Open an ArcMap [.ai] Export in Illustrator
So you’ve read the last article, Some Tips on Map Layout & Exporting a Map to Illustrator and you set up a map layout in ArcMap with the intent to finish the cartographic design in Illustrator. Well there’s a few more things you should know about opening that file in Illustrator. I always rework the layers and grouping of these exports when I get them into the Illustrator environment.
I’ll show you how I organize the map data and prepare for editing. I have a few custom preferences to help this effort, I’ll show you them and how to set them up.
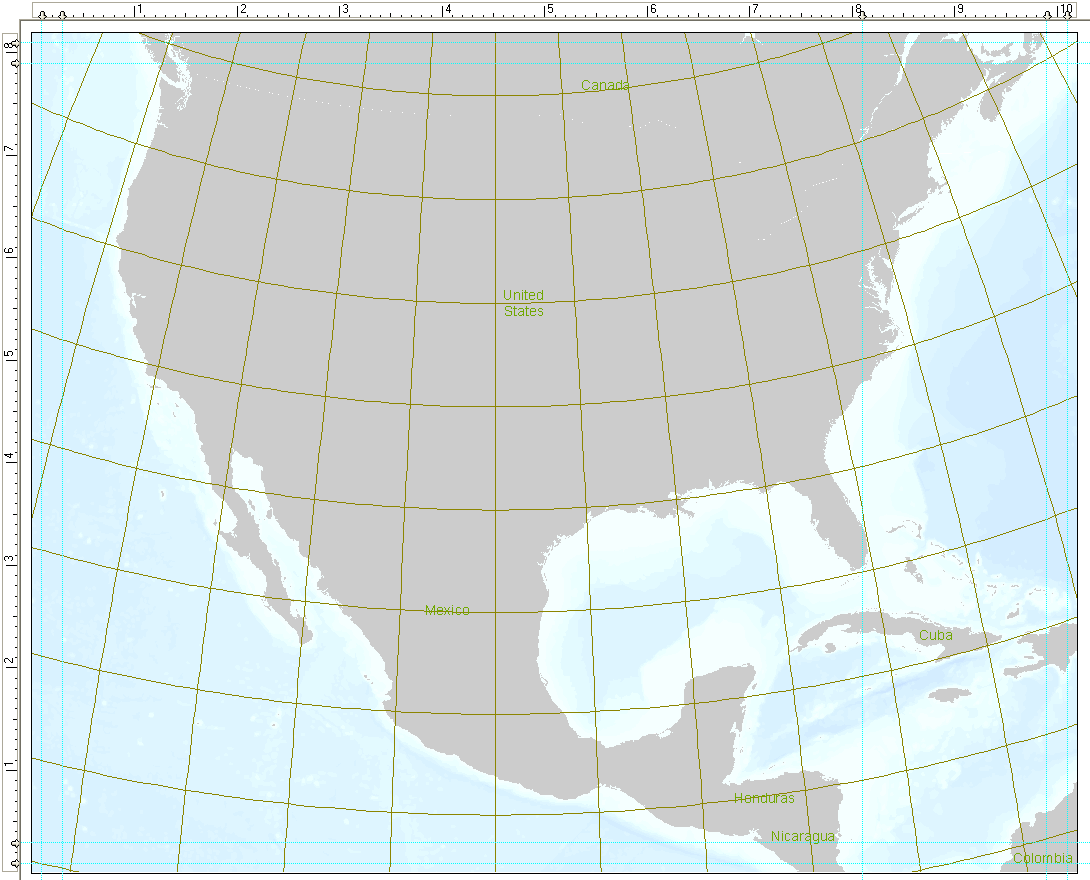
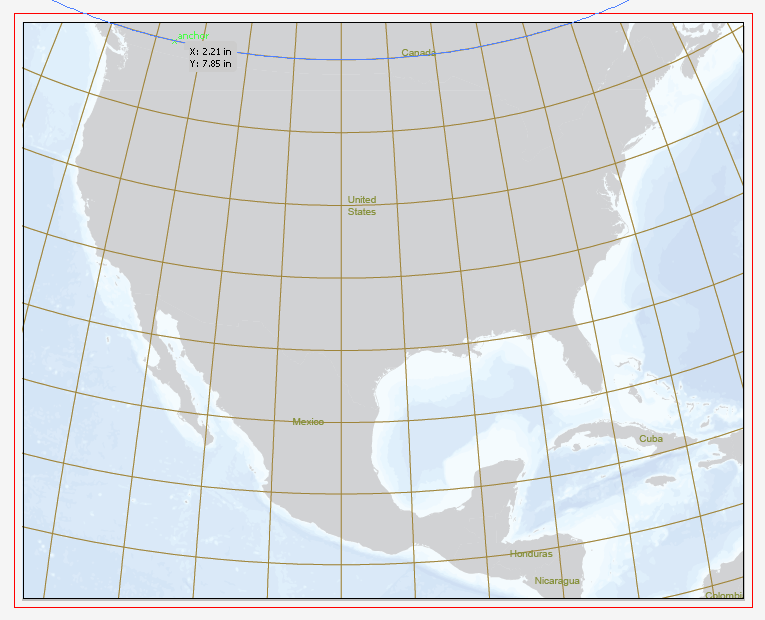
Here’s the map setup in ArcMap that I’ll be working with in the examples.
You can see the extent of the cartographic design applied to the map at this point. Simple and differentiated (by layer/category) symbology and simple labels. I’ve also got the canvas, or paper size, set along with the scale and extent of my map. I have designed the layout around the map’s purpose – a gift that will be placed into an 8 x 10” photo frame. I set the layout page size to 8.2 x 10.2” to accommodate some bleed area. I’ve also adjusted the extent and scale so that my subject falls within the safe area that can be seen when the map is put into the frame (about a 0.1” cushion from the edge on each side).
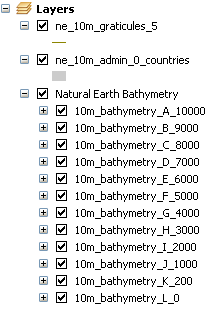
Notice the colors and symbology here. The bathymetry (and the sub categories within the bathymetry layer), graticules and land have different colors applied. The labels have yet another face color. The purpose of this is to set up the data for efficient prep in illustrator. I use the select same fill/stroke and select all clipping masks functionality in illustrator and setting up symbology this way helps gain some efficiency when working in illustrator.
Also note the layers and grouping. I’ll show you how this translates into illustrator layers later.
I’ve exported this layout to an illustrator file [here’s how] and I’m ready to open it and prepare the file for the Illustrator environment.
In Illustrator (I’m using CS4) open the .ai file you’ve exported from ArcMap.
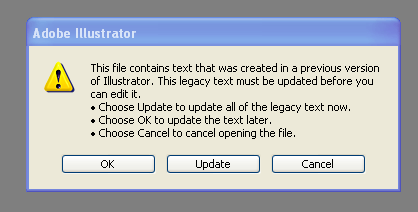
You’ll likely see this warning if your map contains text.
Hit update. This converts the text to a typeface you have readily available in your computer’s font library.
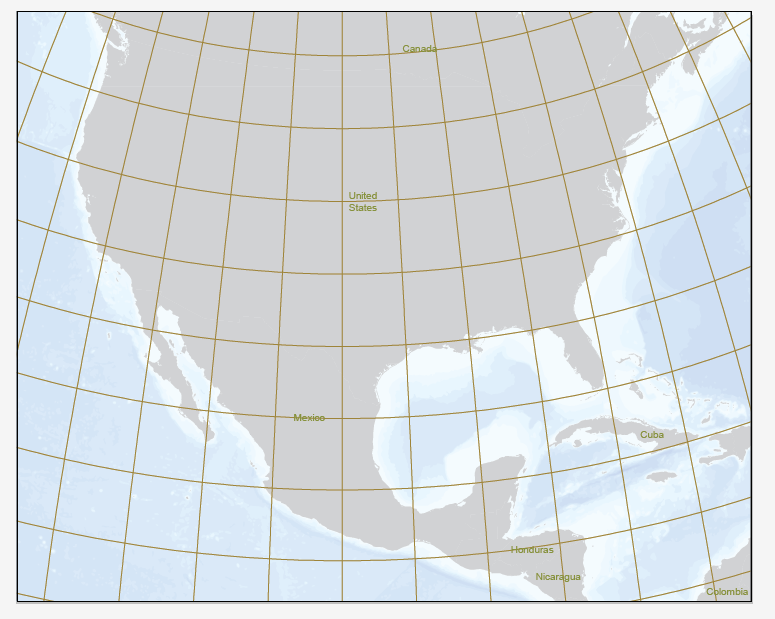
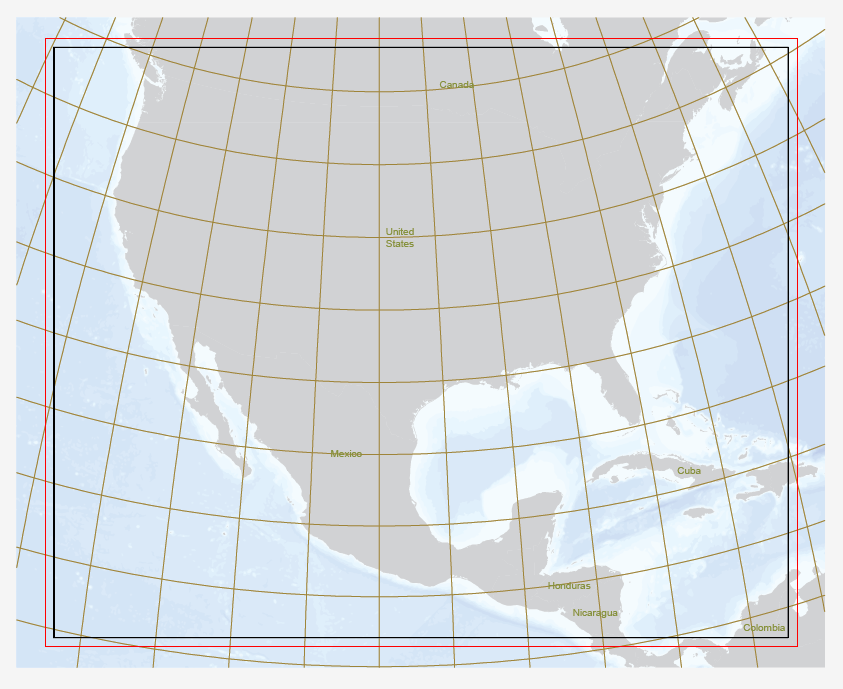
After you hit update, the map will open. Notice that the data seems to stop at the edge of the artboard (equivalent to page layout in ArcMap) or canvas. ArcMap exports each layer with a clipping mask that clips the visual extent of each layer to the paper’s edge. I prefer to delete each of these clipping masks, which gives me the full view of the data I have to work with and allows me to more easily edit the data.
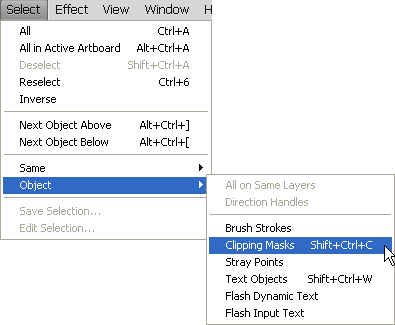
I set a keyboard shortcut to execute the select all clipping masks command (at Select>Object>Clipping Masks).
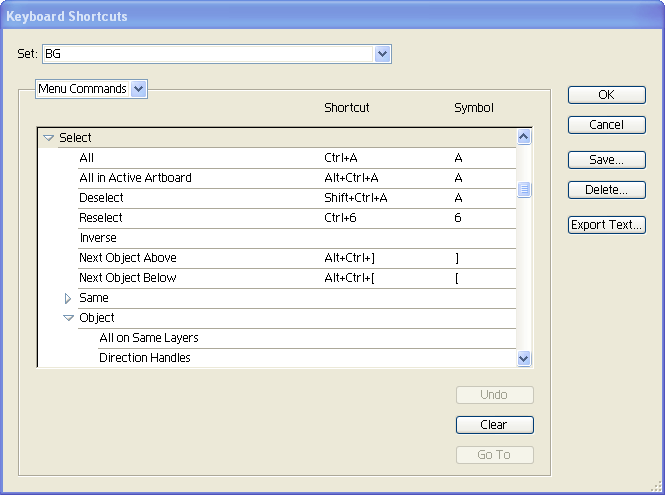
To set this as a keyboard shortcut of your own go to Edit>Keyboard Shortcuts. Change the second dropdown to Menu Commands and expand Select, then expand Object.
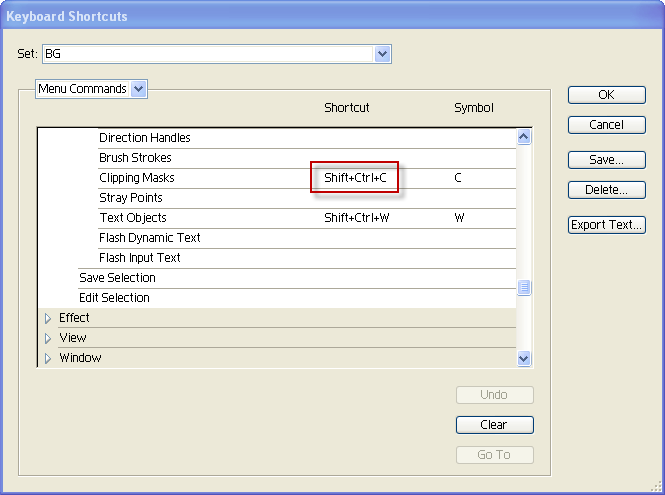
Scroll down, and click on the Shortcut space for Clipping Masks and perform the keyboard strokes that you would like to assign as the shortcut for performing the selection. I have applied the keystroke Shift+Ctrl+C so that when I press these keys simultaneously all clipping masks will be selected. Similarly, I set up keyboard shortcuts for Select>Same>Fill Color (Shift+Ctrl+F) and Select>Same>Stroke Color (Chift+Ctrl+T) to allow selecting based on colors. This way I can select a feature then hit Shift+Ctrl+F to also select all features with the same fill color. I set my symbology in ArcMap so that fill color is unique to a layer (or category) so I can quickly select many features and change symbology.
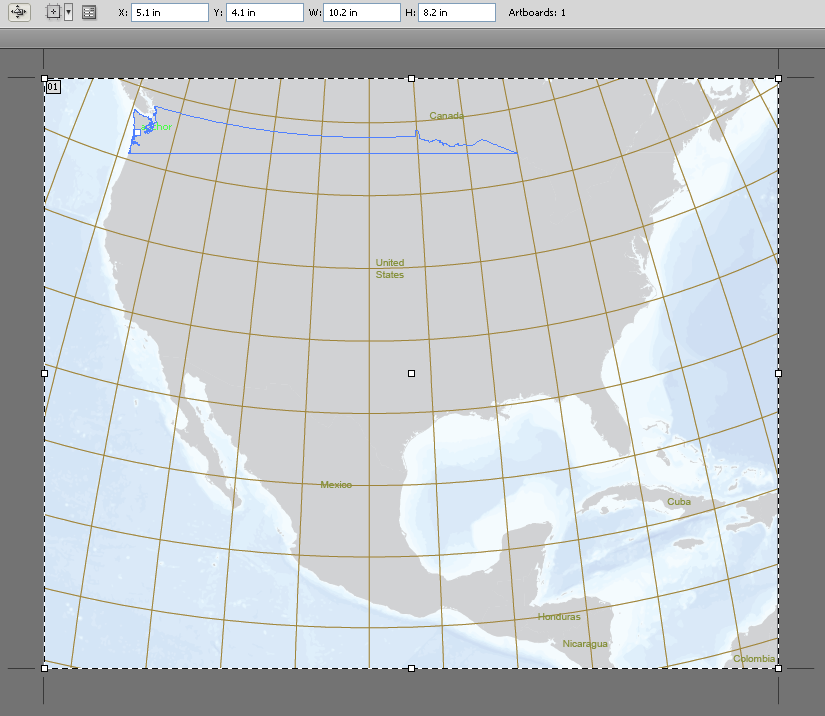
Now that the keyboard shortcut has been created I can apply it on my open map. Before I delete all of the clipping masks I make sure my artboard is set up correctly. Press Shift+o to view the artboard specs.
If you haven’t done so already, now is a good time to save this document. I normally overwrite the original Illustrator file that was exported from ArcMap but you may prefer to save a separate file. Save often as you work!
Illustrator will highlight the artboard and display the dimensions in the toolbar. The dimensions should match the layout dimensions you set up in ArcMap. My map needs to be 8.2 x 10.2″ because those are the dimensions I set in ArcMap. I am going to add a little bit extra bleed area to the artboard so that when I print the map I have a little extra space to adjust to the frame window. (Press V to escape the artboard view and activate the selection tool). Go to File>Document Setup and add a bleed of 0.125” to each edge of the canvas.
A line indicating the bleed area will appear. This allows for some excess ink space so that a full bleed trim can be achieved. Now I’ll remove the existing clipping masks, press Shift+Ctrl+C to select all clipping masks then delete twice. You should now see the true extent of the data.
Keep in mind that if you move any of the data or change the size of the artboard it will be difficult to line up any new data you bring in from ArcMap. If you leave the dimensions of the artboard the same as they were on the ArcMap export you can easily export a new layer of data and copy and paste it into your map then line it up based on the artboard boundary and the clipping path boundaries. Then you can delete the clipping masks and style the new data. This is why it is important to establish your map’s extent, scale and page size in ArcMap and bookmark it!
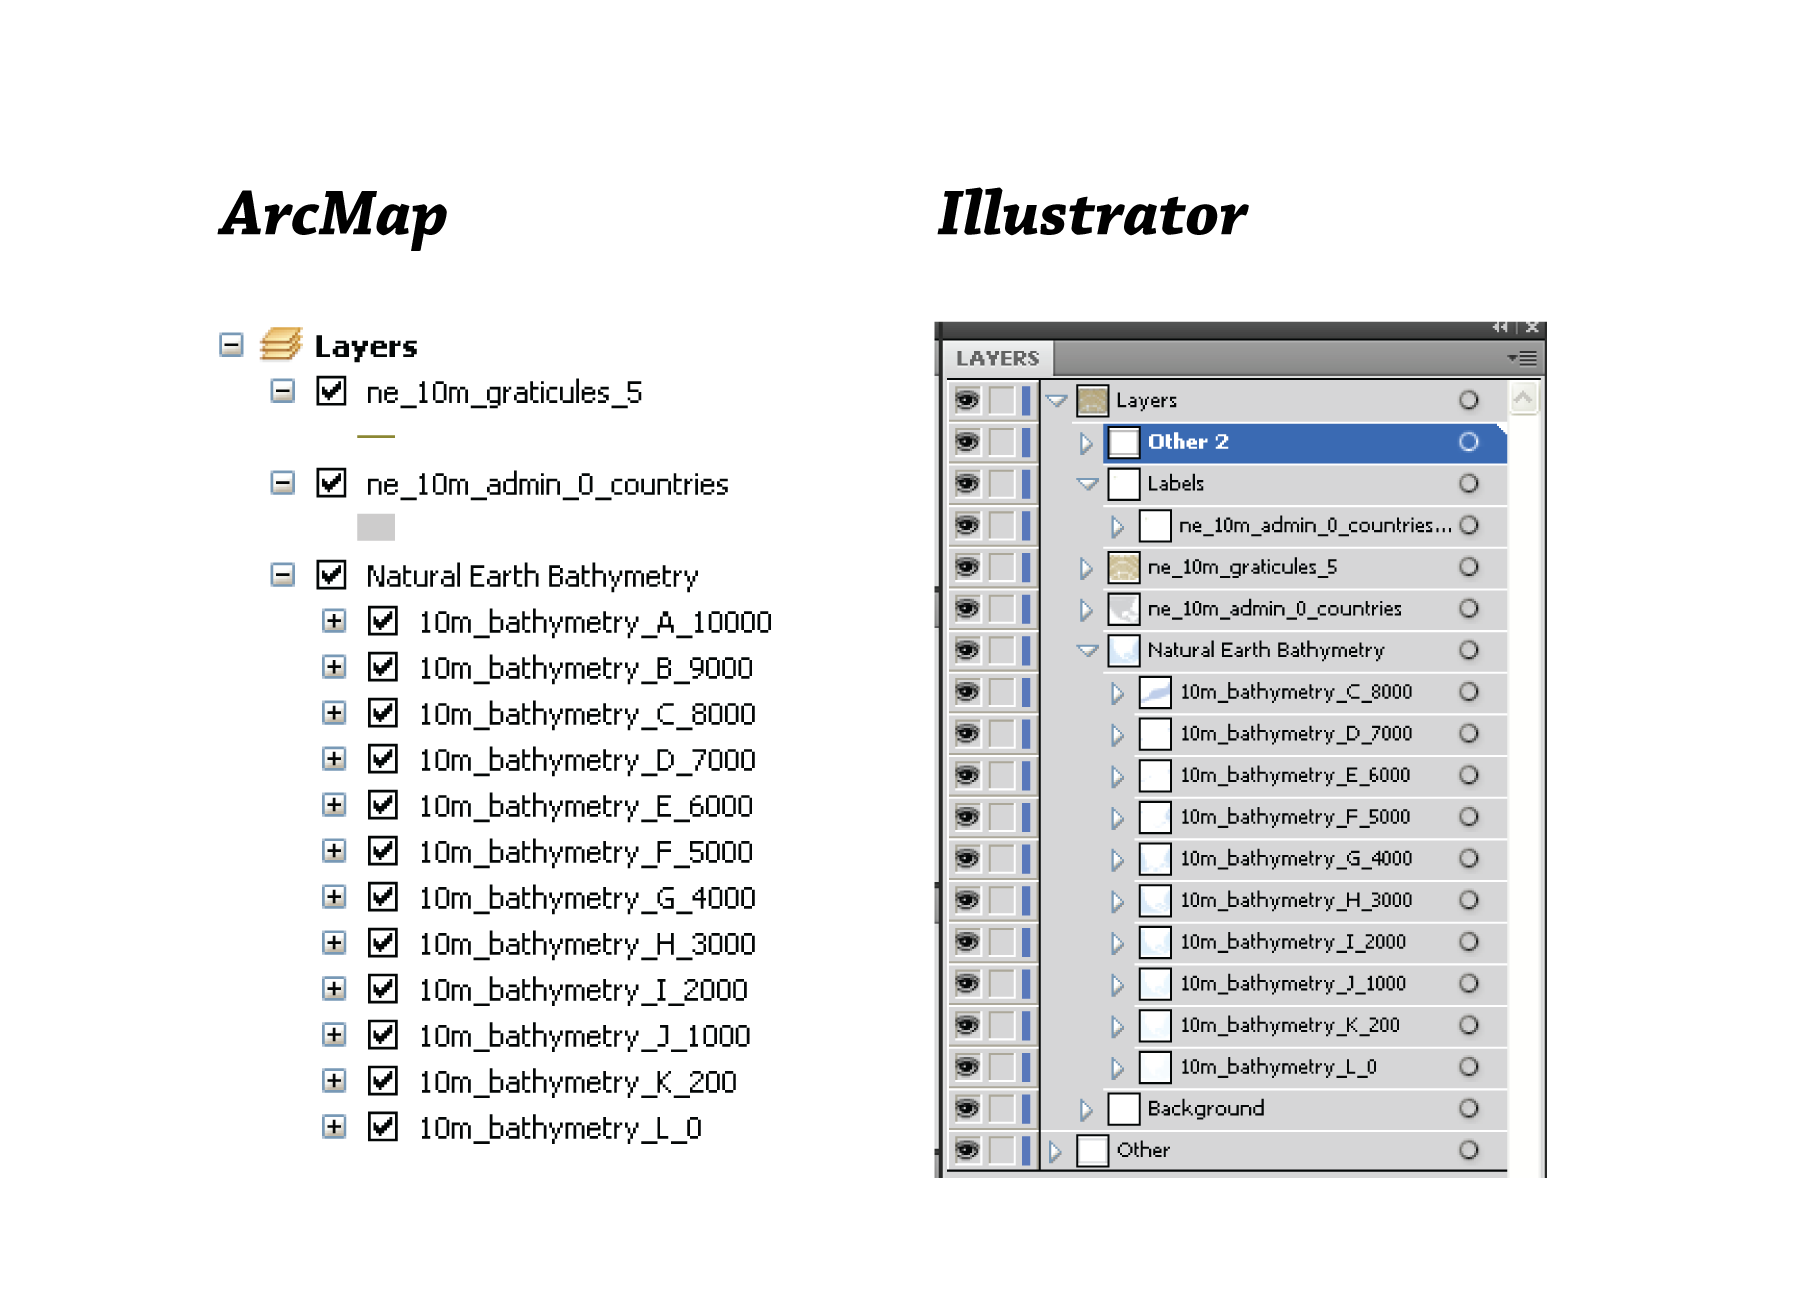
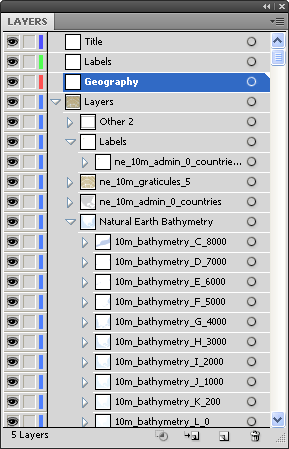
Here’s a side-by-side of the layers as they were organized in ArcMap and how they look translated into Illustrator.
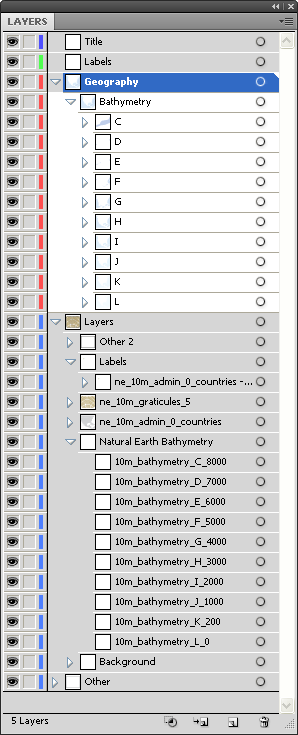
Notice the way the grouping translates into layers and groups in Illustrator. I like to clean this up a bit. I prefer to have separate layers for an alignment grid, the title block, legend, map labels and map geography. Beyond that I organize different elements into groups to make locking, selecting, toggling visibility and isolating data easier. It is somewhat tedious to set up the grouping the way I do, but there’s always the option to set up an action to automate the process. Organizing the layers will save time in the long run, especially if there are future updates to the map.
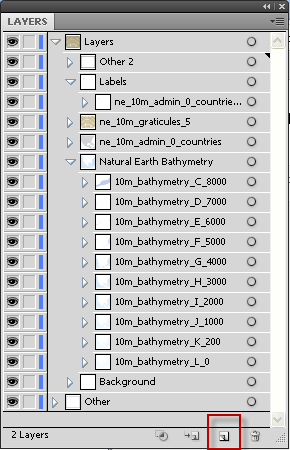
For this map, I’ll add three new layers using the add new layer button at the bottom of the Layers panel.
I name them Title, Labels and Geography. Now I will start ungrouping, regrouping, renaming grouping and pushing my content into the three layers I created.
I’ve pulled each individual group out of its sublayer while maintaining the proper stacking order, then grouped those together and named the layer Bathymetry. The organization is a bit more straightforward than the stock ArcMap export. Here’s what the bathymetry group looks like when I’m done organizing the content.
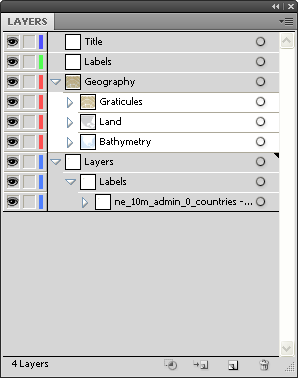
I can now delete the empty original bathymetry layers by selecting them and hitting the trash button or selecting and dragging the layers over the trash button. I’ll do the same for the Graticules and the Land until my layers look like this (at this point you can also delete the Background and Other layers).
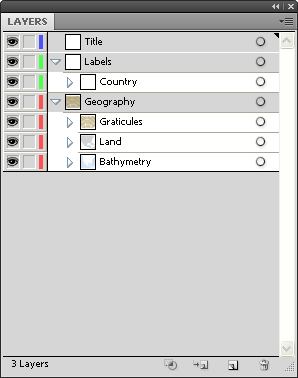
Perform the same operation for the labels and delete the empty source layers.
At this point, I’m happy with the organization of this map and I can start developing more map elements and styling the symbology. I will eventually add many new grouped map elements including titles, text blocks and graphics. I try to be vigilant about grouping pieces of elements and naming those groups. If you do the same you will gain efficiencies and make selecting, isolation, aligning and many other procedures much easier.
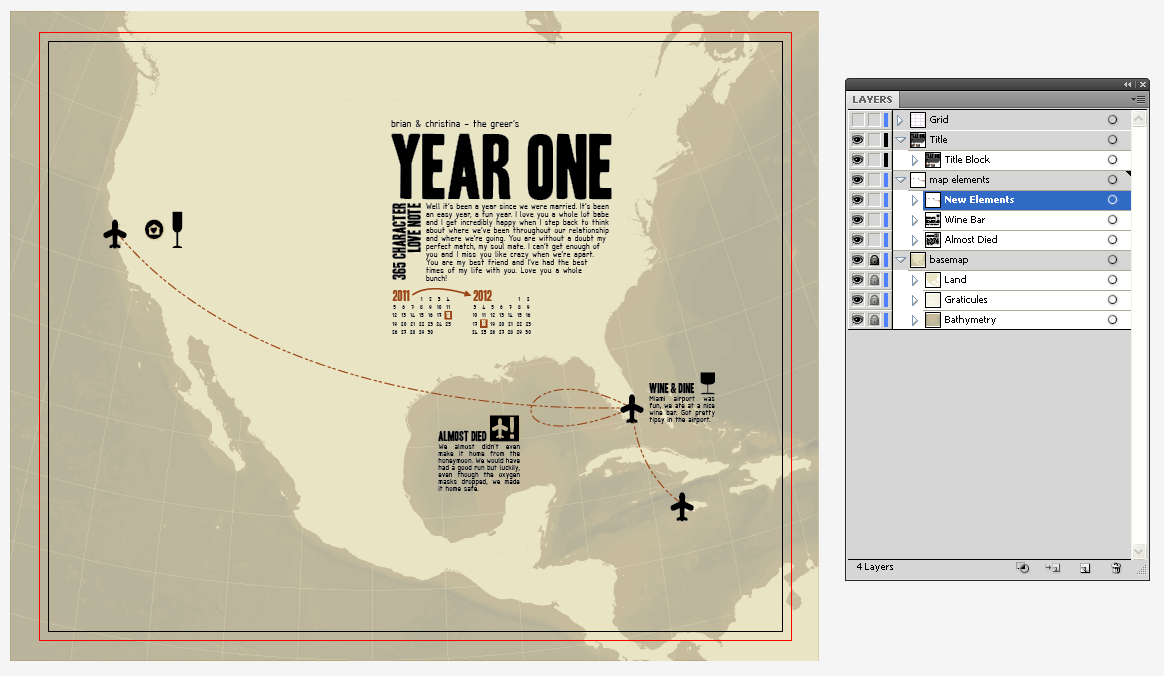
Here’s the same data with a bit of development in symbology and other map elements.
Organization is the foundation for cartography in Illustrator. Notice there’s a bit more going on in this map but the table of contents is not out of control. There are general groups that drill down to specific map elements, making it easy to find the information as well as isolate and manipulate targeted information.
These are just some of the techniques I use for import process. There are more advanced techniques but utilizing these will help build cartographic skills in Illustrator. I encourage you to develop your own process for importing information into Illustrator from ArcMap but I encourage you to maintain a high level of organization – it will lead to greater efficiencies in your cartography.



1 Comment
Erika Pieu
October 16, 2017Thanks for sharing a valuable post.