Data Driven Pages
I recently upgraded to ArcGIS 10 and so far I like it a lot, for the most part. One of the features I like the most, that has already made my life easier, is the data driven pages feature. Instead of using extensions, whether free (ds mapbook) or paid (map logic), fairly robust mapbooking can be achieved in ArcMap out of the box. Using a single map layout and an index layer, a series of maps can be exported in the click of a couple buttons. The extent of each map exported is based on an index layer. Using data driven pages a map series will be exported at the extent of each feature in the index layer. The map series can be exported in a variety of formats including PDF and Illustrator. Data driven pages allows dynamic text to be placed on the map layout that corresponds to an attribute of the index layer. To mask data based on the current page in the series, layer queries are also available.
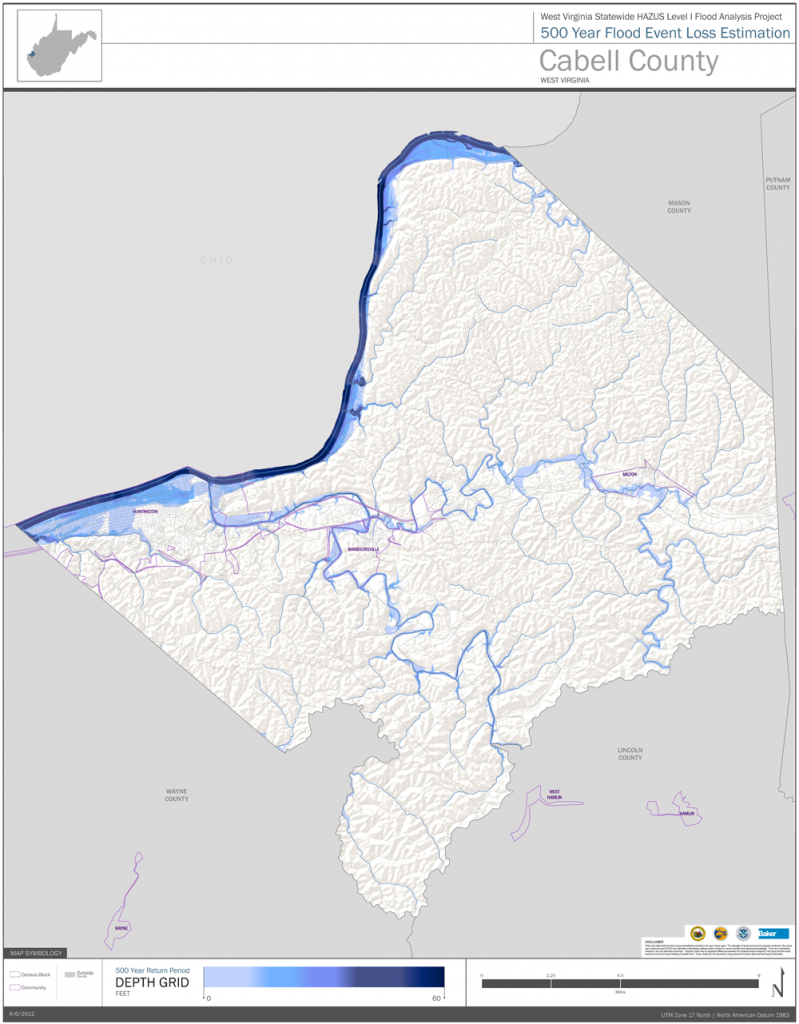
After my recent switch to Arc10, I had to resurrect a few mxd’s that incorporated the map logic extension. These mxd’s incorporated map logic vba and no longer worked in Arc10 without installing developer tools. Data driven pages has allowed me to set up a map series, dynamic title text and locator map easily. Here’s a map layout that incorporates data driven pages. I’ll show you how it’s set up below.
This map series needed to portray some HAZUS analysis results for each county in West Virginia. That means I needed to produce a poster-sized map for each county. An easy way to do that is to set up the map layout and incorporate data driven pages to do the rest. Each map extent corresponds to a feature in the index layer. I want each county extent as an individual map, so my index layer is the West Virginia county layer. Next I design my layout, a large simple main map, a legend, a title and a locator map. After I am happy with the map layout, I set up the map series using the data driven pages toolbar.
Tip
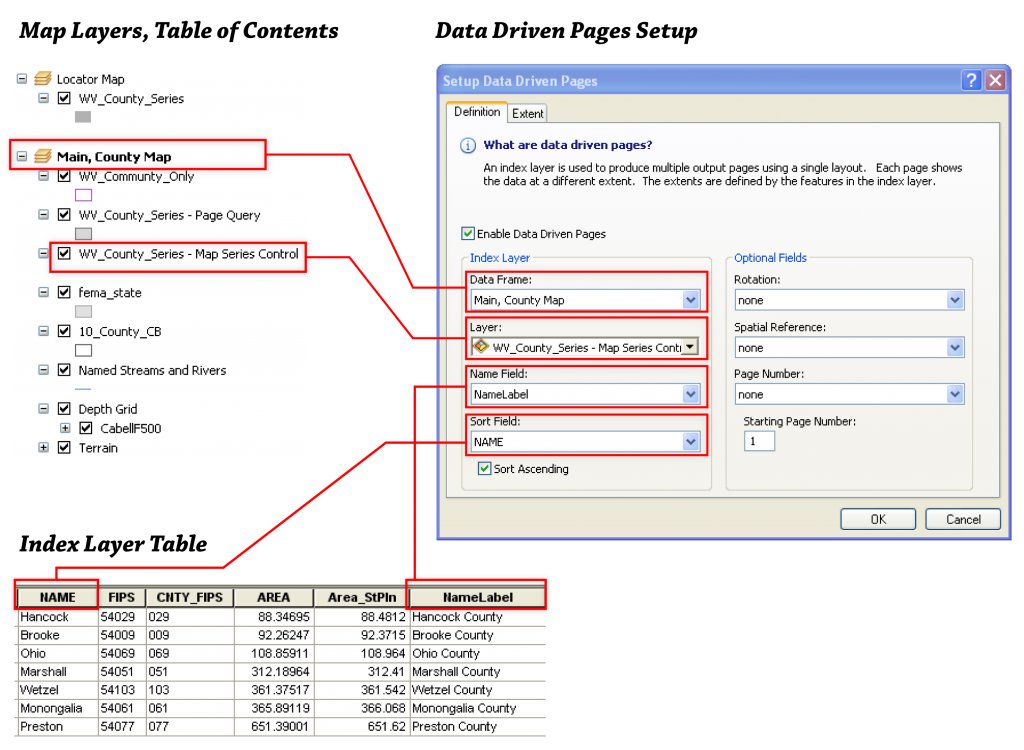
I usually name my index layer in the table of contents with some indicator that it should be the index layer, here I’ve used “Map Series Control” as a suffix to the layer name.
First, if it’s not already there, add the data driven pages toolbar by right-clicking the toolbar area and choosing data driven pages toolbar. You should see something like this.
Before setting up the map series, familiarize yourself with the index layer attributes. You will need a field that contains the naming for each page along with a field that will be used to sort the page ordering of the series. You may have to create a new field for these purposes. Other attributed controlled options include data frame rotation, spatial reference, page numbering and map scale. Also, keep in mind that you can place dynamic text based on the page name. I’ve done that in this series, where the title of the name is dynamic and corresponds to the page name I have assigned. Here’s snapshot of the fields from my index layer that I’ll be using in the data driven pages set up.
I’ll want my map title to include the word “County” so I need to remember to assign the ‘NameLabel’ field as the page name field. I’ll use the ‘NAME’ field to sort the pages (they’ll be sorted in alphabetical order).
Tip
Open your index layer attribute table, then open the data driven pages set up window so you can reference the proper fields if needed.
Hit the Data Driven Page Setup button.
Now check the box to enable Data Driven Pages and point at the data frame that contains your index layer (and your other map layers).
Here’s how I set up the map series for this example.
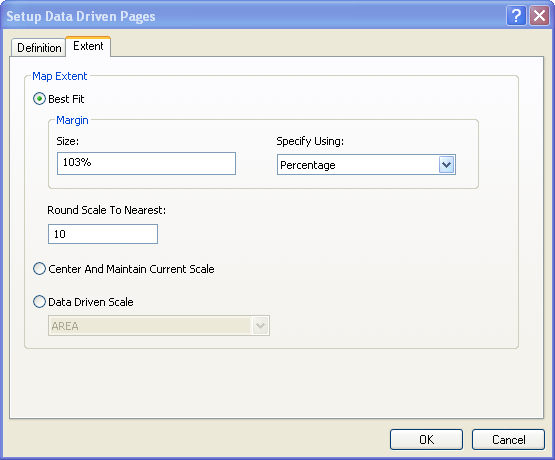
This configuration will generate a map series including a map for each of the counties in West Virginia, where each layout is named based on the “NameLabel” field and sorted in ascending order based on the “NAME” field. Note that I have not used any of the optional attribute driven options on this tab of the setup menu. The Extent tab of the setup menu allows the user to control the scale and extent of each map.
Here, I’ve chosen the best fit option at 103% ensure that I capture each county in its full extent with some extra buffer area. You can see the additional options to maintain a consistent scale or derive the scale based on an attribute stored in the index layer’s table.
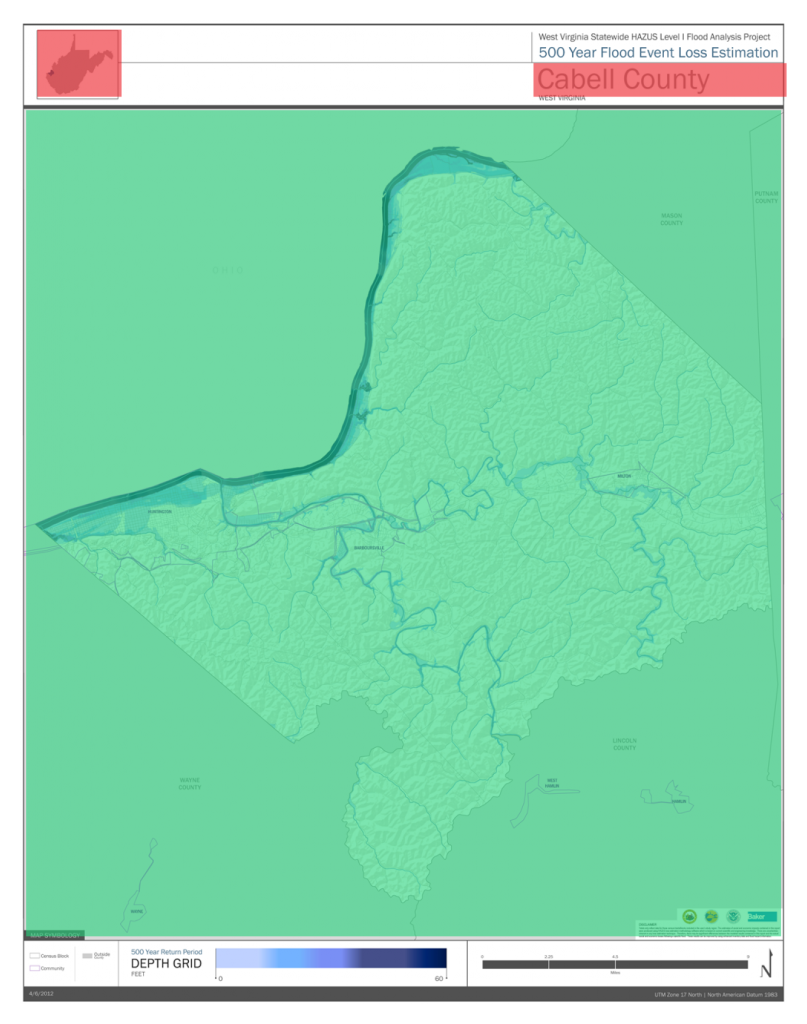
Press okay and your map series will be generated. So far the only part of our map series layout that is complete is the main map area, highlighted in green below. We’ve still got to set up the dynamic locator map and map title, highlighted in red below.
To build the dynamic title, go to the Data Driven Pages toolbar, hit the Page Text drop down and choose Data Driven Page Name.
This will add a text box in the middle of the data frame that reflects the current page’s name as assigned in the setup menu. You can move and style the title as needed. Hit the next page button on the Data Driven Pages toolbar and watch the map extent and title text change.
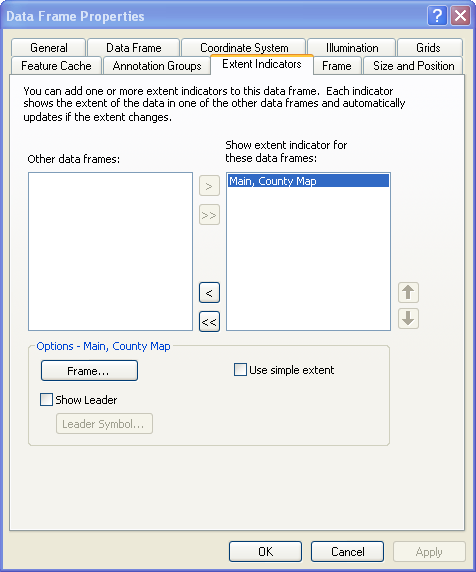
To complete the dynamic layout the locator map needs to become a dynamic locator. Make sure you have relevant data in your locator data frame. My goal with this layout is to have a simple locator that highlights the current county within the state. The only data I have in the Locator Map data frame is the county layer, styled with no outline and a simple, light grey fill. Go to the Properties of the Locator Map data frame and the Extent Indicators tab.
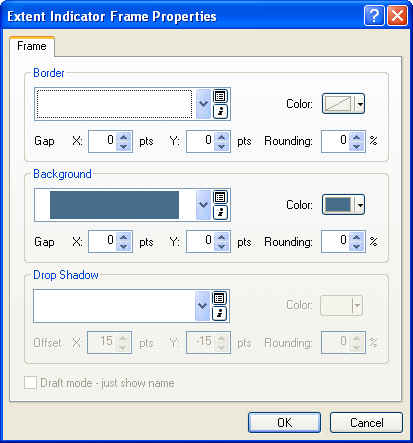
Highlight the Main data frame and move it to the right side to show the extent. Uncheck “Use Simple Extent and Show Leader then hit the Frame button.
I have assigned a simple solid fill with no stroke that will contrast the state fill I set up previously. This will highlight the extent of my detailed, main data frame within the state. Hit OK and change the map page again to see the locator in action.
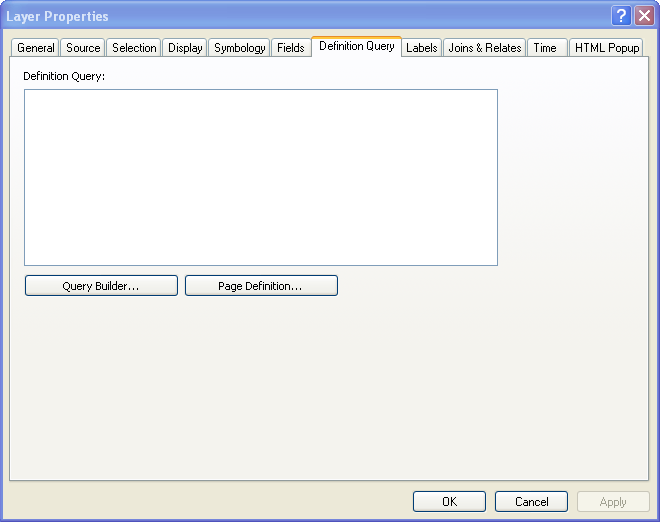
Another feature that I have incorporated in this map is a dynamic mask. I only want the data and symbology for the current county to be shown on the map. Once you have completed the initial setup of the Data Driven Pages you can add a masking layer that have a dynamic visibility query based on the current page. I’ve added an additional county layer with a simple grey fill for this purpose. Go to the layer properties of the mask layer, hit the Definition Query tab and press Page Definition.
Now you can control how the mask works. Check Enable and choose the appropriate Page Name field that you assigned earlier (the Page Name field is important for this Data Driven Pages stuff & should be unique!). Because I want everything outside the current county to be masked I choose “Don’t Match” which will create the hole I need to see through the mask layer to the data for the current county. Press OK and OK, then change the page to see this in action.
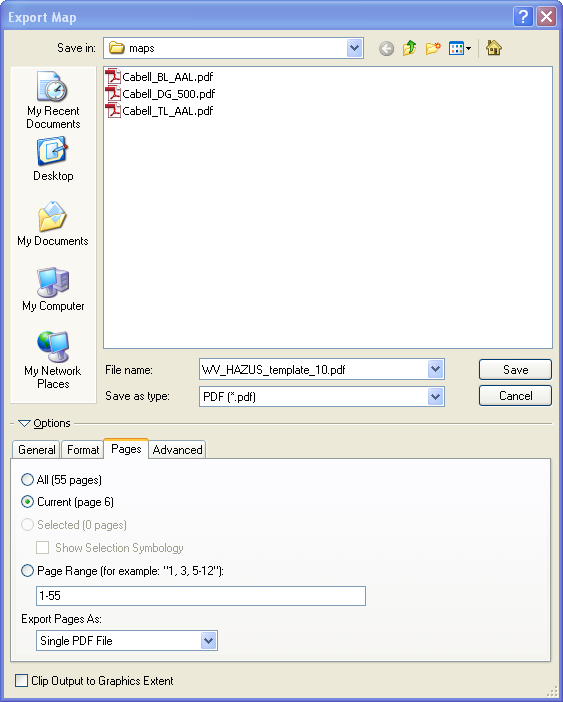
To export your map series go to File > Export.
Note the Pages tab. After setting up the export format make sure to visit the Pages tab. Here you can export a single map from your series, a specific range or the whole set.
Data Driven pages is a very nice feature of ArcMap 10. Use your imagination and creativity and you will get some very interesting and useful results. This should also bump up your cartographic efficiency a bit if you have a series of maps to make. If you have any questions or if anything is unclear, please comment below and I will try to help! Also, please explore dynamic text in Arc10. More to come on that later.





2 Comments
Ali Kuemmel
August 14, 2013Thanks for posting this tutorial- it was easy to follow and allowed me to use this tool quite effectively for my first try!
I Gray
May 20, 2014Thank you so much for this, I have been trying to do this for quite a while and you have described it so well!