Illuminated Point Symbology
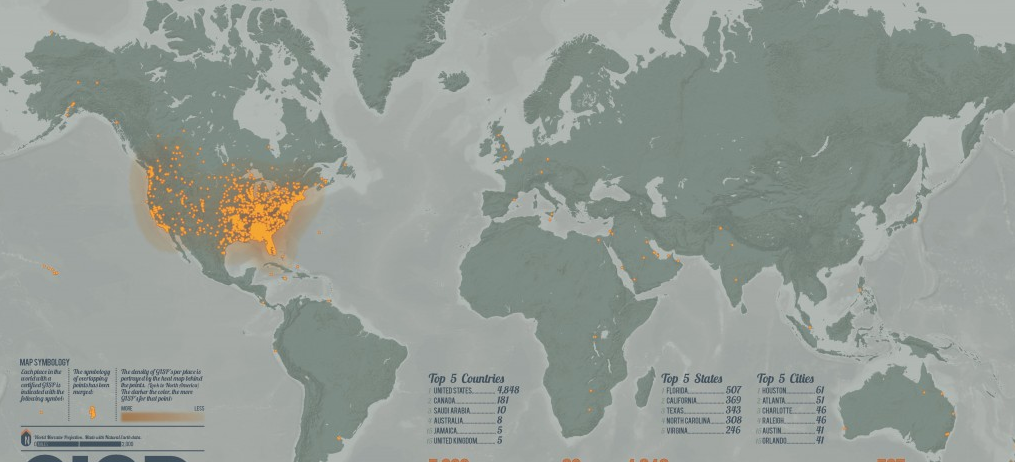
This will be a quick one, I’ll overview how I created the glowing/heat effect on the GISP location points in my GISP map. The points represent cities where there is a GISP certification. These points also have an attribute for the number of GISP’s in that city but I will not be representing that information with the dots. I want to create an effect for the points in close proximity that will draw the eye and convey the close proximity and general density of GISP’s in the world. The map is drawn at the world scale at a page size of 11 x 17 inches. This effect will allow the reader to identify the general density of GISP’s then investigate the map’s accompanying figures for extra information.
To begin, the map is laid out, projected and scaled in ArcMap. The points are symbolized with a simple circle marker with no stroke. Here’s what the US looks like in ArcMap. I’ve covered setting up a map for export to Illustrator here.

Opening this in illustrator (which I’ve also covered, here) the points look pretty much the same.
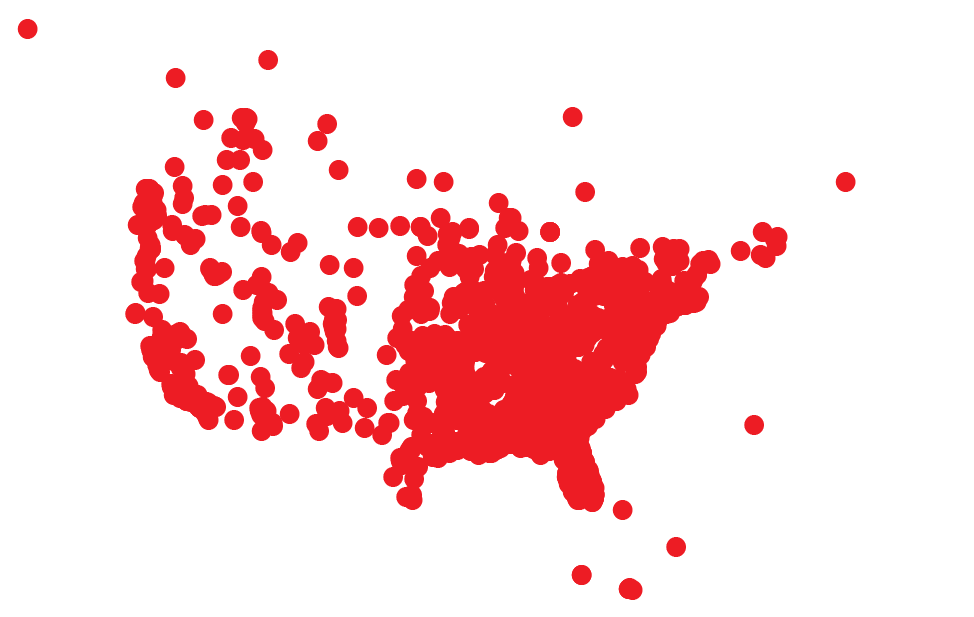
After removing any clipping masks, select all of the points and reduce the typeface size a bit, the points are a little big for my liking and a smaller symbol will allow more detail. I’ve dropped the size down to 5pt. You can do this by selecting the group of points in the table of contents.
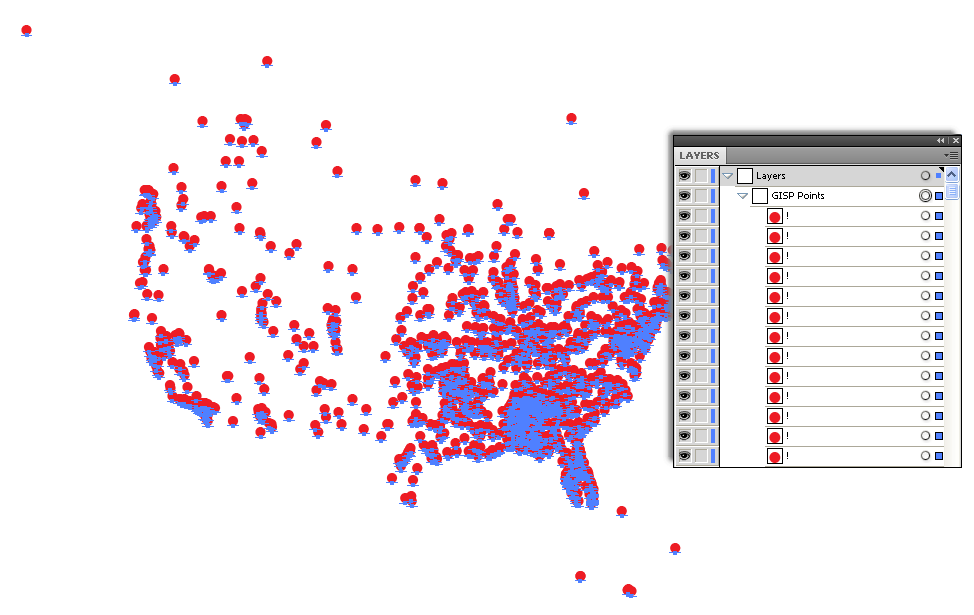
Next step is to convert these type elements to outlines, select the group of points again if it is not still selected and go to Type>Create Outlines to outline each point.

Notice that there are a lot of vertices in each outline. These can be cleaned up to make working with these points a little quicker. With the points selected go to Object>Path>Simplify. Enter 99% for the Curve Precision and leave everything else at default. This will reduce the amount of vertices, or anchors to 2 per point.
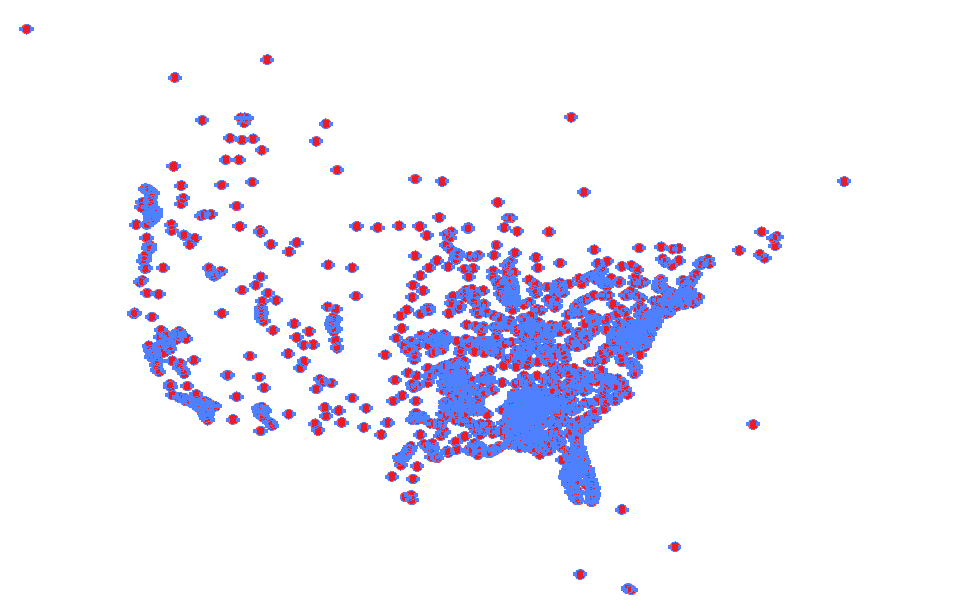
I still need to merge the overlapping outlines to create merged areas that will reflect the more intense proximity of points. With all of the GISP point outlines selected, go to the pathfinder panel (Window>Pathfinder) and hit Unite. Notice the effect of the Unite function to merge overlapping shapes into one.
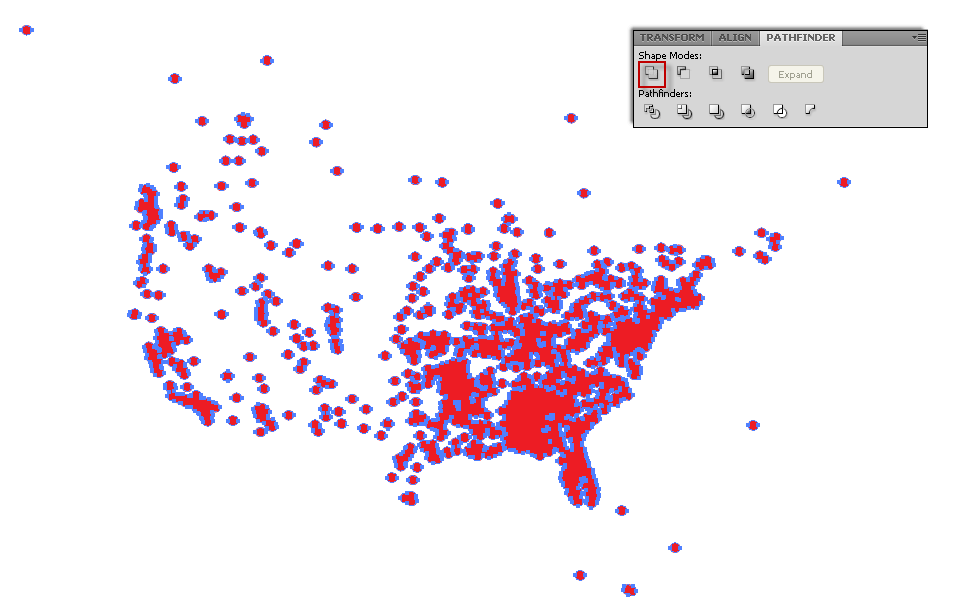
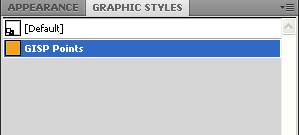
Now I need to set up my symbology for the points. I’ve designed the appearance as shown and saved it into the graphic styles panel.
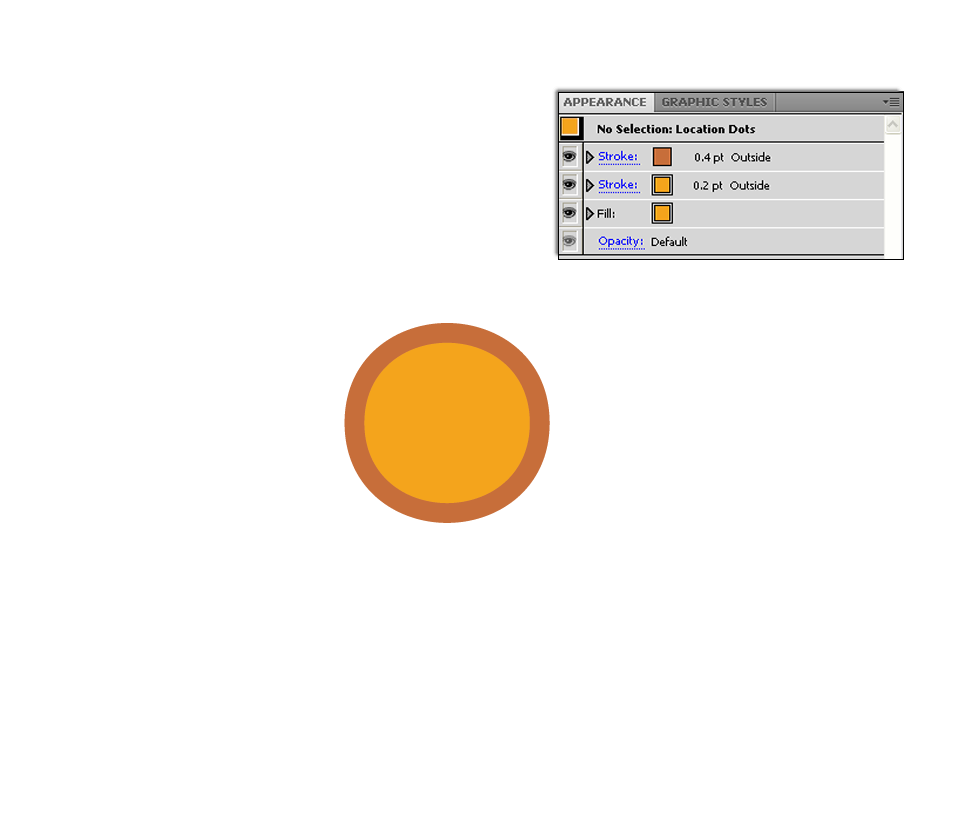
I saved the appearance by selecting a single point that’s symbolized as shown above (with the direct selection tool, the white one, hit A on your keyboard, then change to the selection tool, the black one, hit V on your keyboard) and dragged it into the Graphic Styles window, naming it GISP Points.
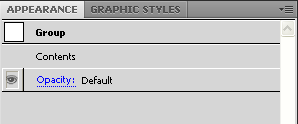
To apply this Graphic style to the group of United GISP points, first select the entire group and open the Appearance panel. Double-click contents in the appearance panel while the entire group is still selected.
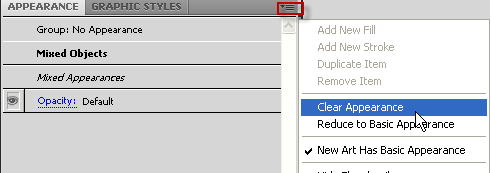
Hit the flyout menu button and choose clear appearance.
The points should now have no symbology.
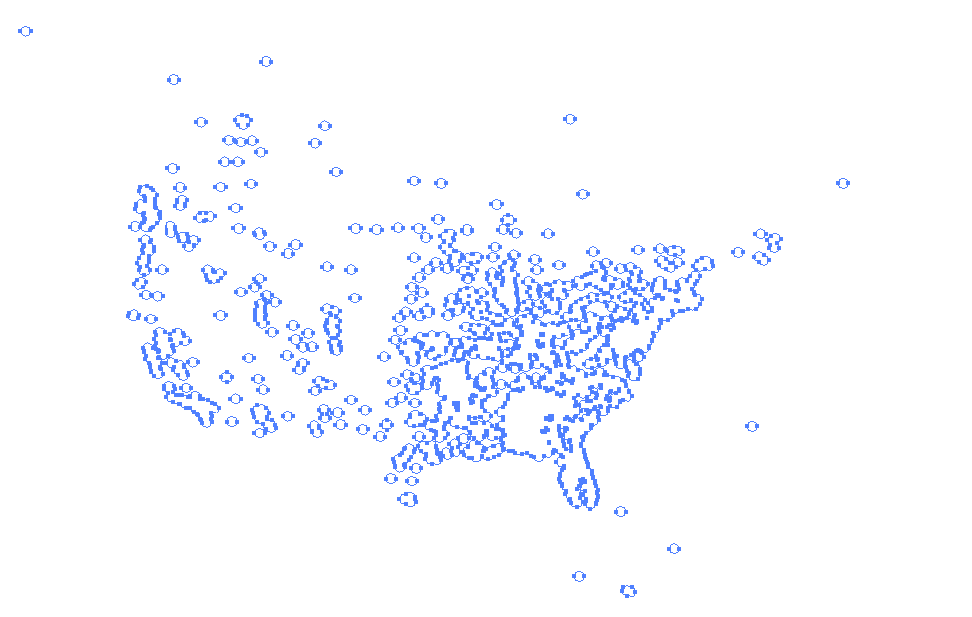
Now hit Group in the Appearance panel to go back to the GISP Point’s group appearance settings.
With the group selected and the Appearance panel at the group level, go the Graphic Styles panel and click the GISP Points Graphic Style saved earlier and group of points will reflect that symbology.
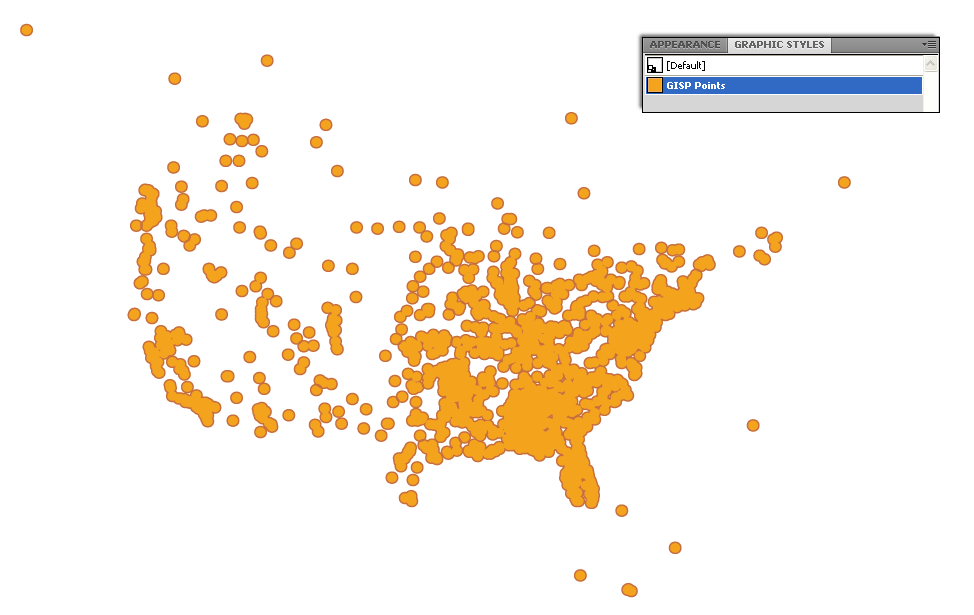
The symbology is applied to the group so that the strokes merge uniformly. As a best practice, I always try to apply Appearances to groups as Graphic Styles rather than individual shapes.
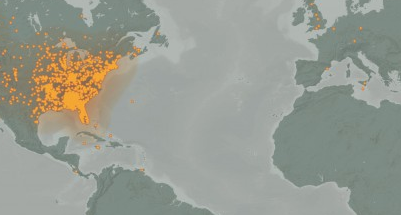
There you have it. This symbology effect coupled with the dark background of the map really pops the overlapping points and draws attention to areas with a lot of GISPs. I’ve provided the Illustrator CS4 file with the points at each step in the download link below.




1 Comment
Sammo034
February 24, 2015I really like this map, nice design. Unfortunately, I don’t have access to illustrator.
I just tried this only using ArcMap and got similar results.
– Created a small buffer around the point features,
– Set dissolve type as ALL,
– Symbolized the same as you did.
-Created another buffer (this time a larger one)
-Dissolve type to ALL
-Set the layer transparency transparency to 90%
(This created the transparent back ground to the points that you have in the final map)